
Page 14 - LH_Research_Report_2020_Eng
P. 14
Manifestation of supply shortfall: rising property prices and ifestation of supply shortfall: rising property prices and
Man
s
shrinking living spacehrinking living space
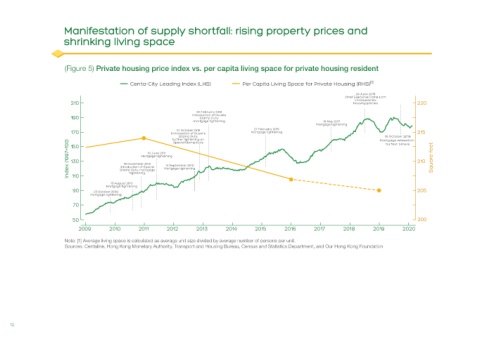
(Figure 5) Private housing price index vs. per capita living space for private housing resident
Centa-City Leading Index (LHS) Per Capita Living Space for Private Housing (RHS) [1]
29 June 2018
Chief Executive Carrie Lam
introduced six
210 housing policies 220
22 February 2013
190 Introduction of Double
Stamp Duty;
mortgage tightening 19 May 2017
Mortgage tightening
27 February 2015
27 October 2012
170 Introduction of Buyer's Mortgage tightening 215
Stamp Duty; Mortgage relaxation
16 October 2019
further tightening on
Index (1997=100) 130 Introduction of Special Mortgage tightening 210 Square feet
Special Stamp Duty
for first timers
150
10 June 2011
Mortgage tightening
19 November 2010
14 September 2012
Stamp Duty; mortgage
tightening
110
13 August 2010
Mortgage tightening
90 23 October 2009 205
Mortgage tightening
70
50 200
2009 2010 2011 2012 2013 2014 2015 2016 2017 2018 2019 2020
Note: [1] Average living space is calculated as average unit size divided by average number of persons per unit.
Sources: Centaline, Hong Kong Monetary Authority, Transport and Housing Bureau, Census and Statistics Department, and Our Hong Kong Foundation
12
12