Page 72 - 20211214_OHKF_Health_Finance_Research_Report_E (1)
P. 72

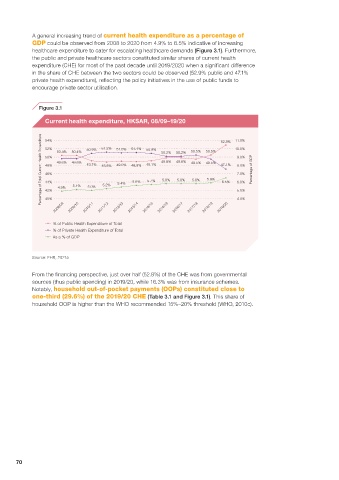
A general increasing trend of current health expenditure as a percentage of
            GDP could be observed from 2008 to 2020 from 4.9% to 6.5% indicative of increasing
            healthcare expenditure to cater for escalating healthcare demands (Figure 3.1). Furthermore,
            the public and private healthcare sectors constituted similar shares of current health
            expenditure (CHE) for most of the past decade until 2019/2020 when a significant difference
            in the share of CHE between the two sectors could be observed (52.9% public and 47.1%
            private health expenditure), reflecting the policy initiatives in the use of public funds to
            encourage private sector utilisation.


               Figure 3.1

                 Current health expenditure, HKSAR, 08/09–19/20                52.9%  11.0%

               Percentage of Total Current Health Expenditure  52%  50.4%  50.4%  50.9%  51.2%  51.0%  51.1%  50.9%  50.2%  50.2%  50.5%  50.5%  47.1%  10.0%  Percentage of GDP
                 54%


                 50%
                                                                                    9.0%
                                                               49.8%
                                                          49.8%
                     49.6%
                          49.6%
                                                                         49.5%
                                                                    49.5%
                                                    49.1%
                                          49.0%
                               49.1%
                                                                                    8.0%
                                               48.9%
                 48%
                                     48.8%
                 46%
                                                                                    7.0%
                                                                          5.9%
                                                                    5.8%
                                                               5.8%
                                                          5.8%
                                                     5.7%
                                                5.6%
                                                                                    6.0%
                                                                               6.5%
                 44%
                                          5.4%
                                     5.2%
                           5.1%
                                5.0%
                     4.9%
                 42%
                                                                                    4.0%
                 40%
                    2008/09  2009/10  2010/11  2011/12  2012/13  2013/14  2014/15  2015/16  2016/17  2017/18  2018/19  2019/20  5.0%
                    % of Public Health Expenditure of Total
                    % of Private Health Expenditure of Total
                    As a % of GDP
            Source: FHB, 2021a
            From the financing perspective, just over half (52.9%) of the CHE was from governmental
            sources (thus public spending) in 2019/20, while 16.3% was from insurance schemes.
            Notably, household out-of-pocket payments (OOPs) constituted close to
            one-third (29.6%) of the 2019/20 CHE (Table 3.1 and Figure 3.1). This share of
            household OOP is higher than the WHO recommended 15%–20% threshold (WHO, 2010c).


       70
   67   68   69   70   71   72   73   74   75   76   77